
A Guide to the Amphibians
and Reptiles of California
Waveform and Sonogram Images

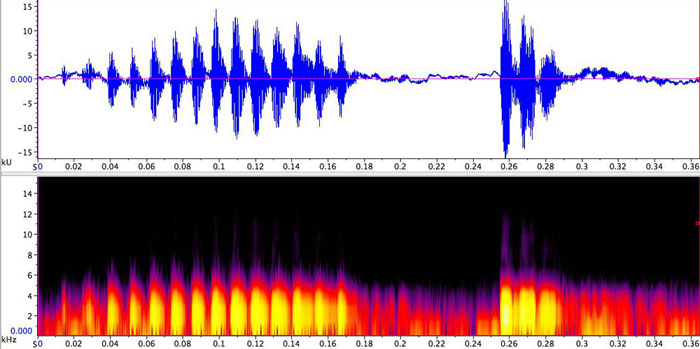 |
| Both images are read from left to right. The top image is a depiction of the Waveform of the sound, which you can listen to here. The X axis (on the bottom) shows the time or duration of the sound, measured in seconds. The Y axis (on the left) shows the volume of the sound. The higher the blue drawing is above the zero line, the louder the sound. The bottom image is a Sonogram. The X axis (on the bottom) shows the time or duration of the sound, measured in seconds. The Y axis (on the left) shows the pitch of the sound, measured in kHz (1 kHz = 1000 cycles per second.) Higher pitched sounds appear higher. Louder tones are shown in a brighter color. Longer tones are shown as longer marks (left to right.) The waveform/sonogram images were created using Raven software from the Cornell Lab of Ornithology. |
Return to the Top
© 2000 -